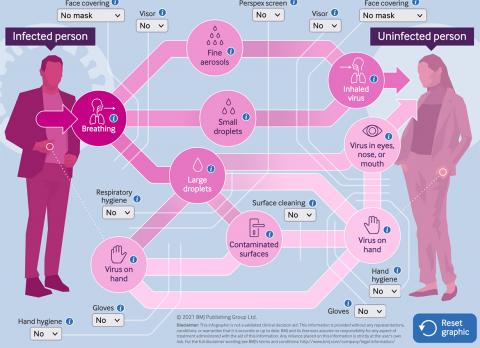
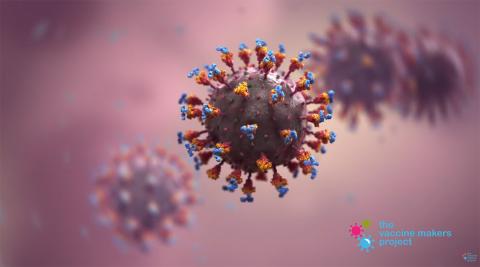
The British Medical Journal published an excellent interactive tool to visualise the estimates of COVID transmission as defined by experts in different scenarios. TL;DR; It's airborne, wear a FFP3 mask.
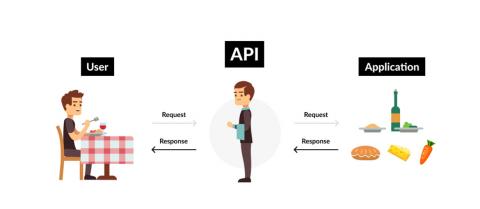
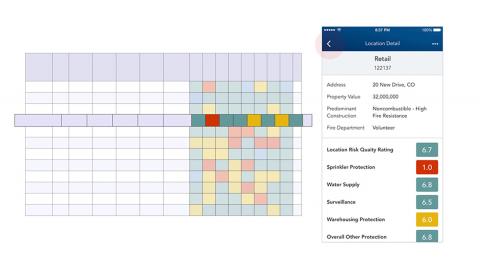
Emna Ayadi published a great blog post detailing the best way to approach testing an API, including using the heuristic POISED (Parameters, Output, Interop, Security, Errors, Data).
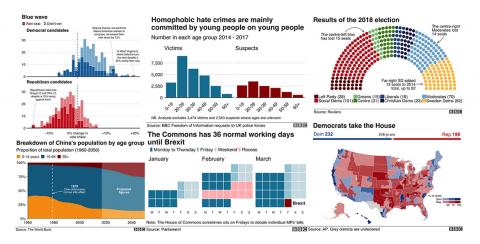
The BBC Visual and Data Journalism team publish an interesting blog on how they rolled out the use of R's ggplot2 package to create graphics and data visualisations on the BBC News website.
There are a lot of assumptions in Amaca's blog about how he got wealthy without working too hard, but the post is nevertheless interesting & might spark a life rethink for some. Applying the 80/20 rule to any aspect of your life is always worth considering, and so it getting out of the rat race.
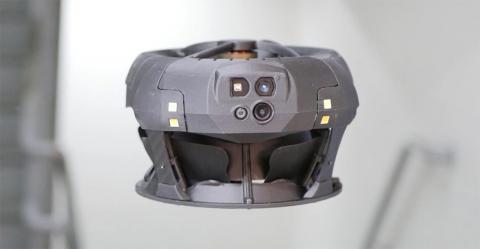
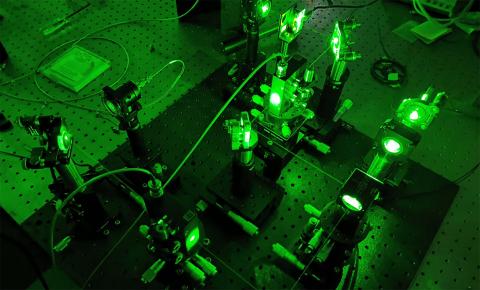
Researchers at Northwestern University have built a scattered light holographic camera that can see the unseen. The camera indirectly scatters coherent light onto hidden objects and detects any subsequent light scattering that arrives back into the camera. An image is then reconstructed using this returned scattered light to visualise hidden objects.