Image: Flowing Data
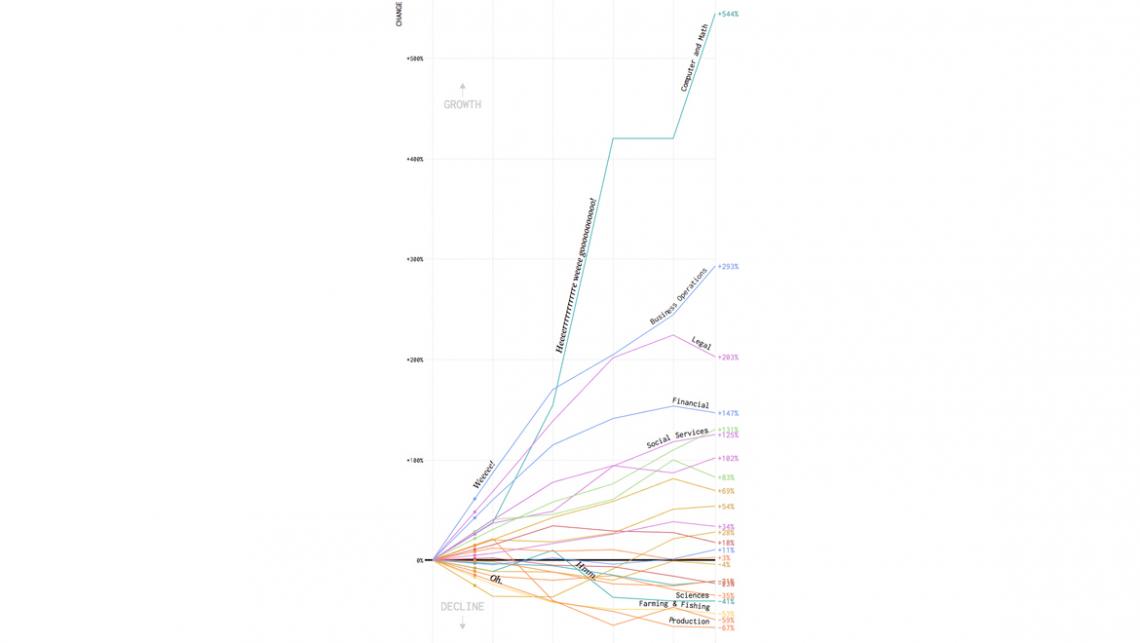
Flowing Data compiled American occupation data from 1970 to 2017 and have produced a lovely graph of occupation growth and decline.
Source:
Image: Flowing Data
Flowing Data compiled American occupation data from 1970 to 2017 and have produced a lovely graph of occupation growth and decline.