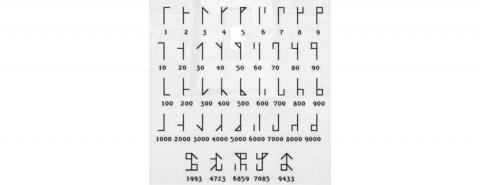
Highlighted by MathematicsUCL on Twitter, Cistercian monks in the 13th century developed a cypher system to prepresent numbers from 1 to 9999 in one symbol.
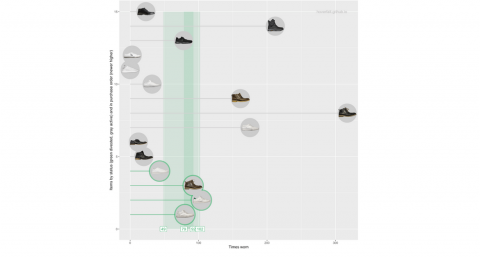
Olof Hoverfält tracked every piece of clothing that he wore for three years. The resulting analysis, data and charts published on Reaktor is a fascinating read. Olof analyses his clothing on cost per wear, performance and sustainability. His advice after three years is buy and wear what you need and love, and don't waste time on second tier clothing.
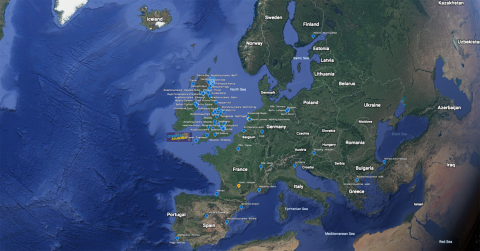
Pete Stollery has created a project on Google Earth called COVID-19 Sound Map that allows people to upload soudns of their environments during lockdown to Google Earth. You can explore what the lockdown sounds like aroudn the world here.
Five Thirty Eight have written a piece describing how easily COVID-19 can spread during multiple Thanksgiving dinners. Things to keep in mind for Christmas dinner.
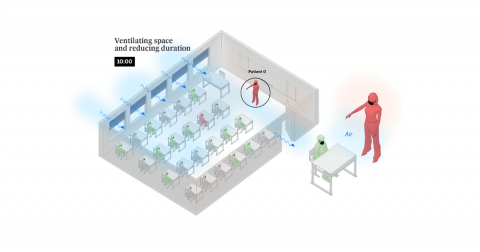
El País published another great COVID-19 data visualisation this week (first one here) illustrating the spread of aersols indoors in a room, bar and classroom. Mask and adequate ventilation severly reduce the risk of contamination.
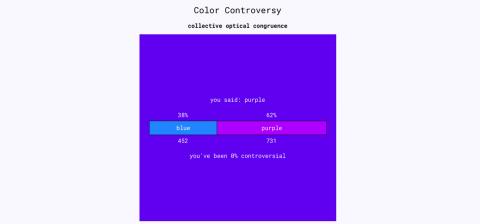
I often have "discussions" with my wife over the designation of particular colours, particularly the colour of the paint in our sitting room which I say is grey and she says is light blue. Have some mindless clicking fun this Friday afternoon with Colour Controversy, a site that serves you up a colour and asks you to pick from two possible answers. The percentage answers are shown after you pick, and you can even see a leaderboard of the most controversial colours!