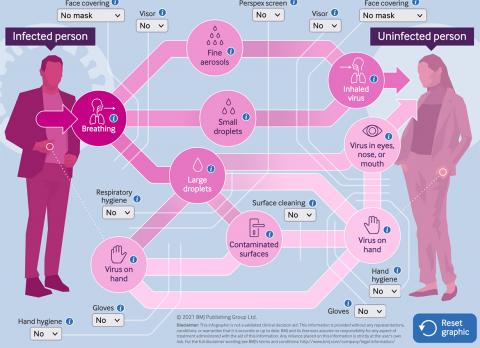
The British Medical Journal published an excellent interactive tool to visualise the estimates of COVID transmission as defined by experts in different scenarios. TL;DR; It's airborne, wear a FFP3 mask.
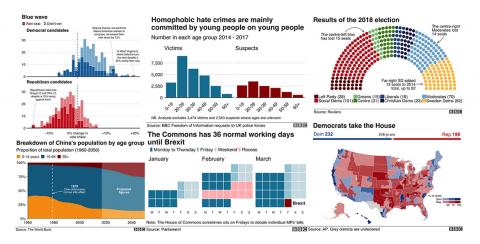
The BBC Visual and Data Journalism team publish an interesting blog on how they rolled out the use of R's ggplot2 package to create graphics and data visualisations on the BBC News website.
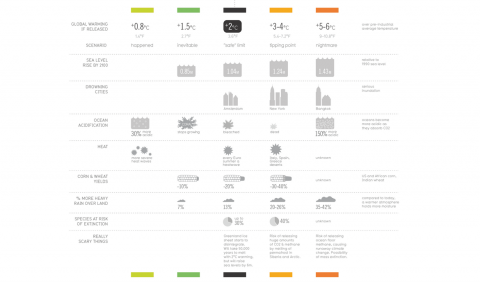
Information Is Beautiful illustrates the difference between 1.5°C vs 2°C vs 4°C temperature increases when it comes to sea level rises, ocean acidification, heat & food production. Bear in mind 1.5°C is inevitable and the bare minimum that will happen and we are currently on track for 2.4°C temperature increase.
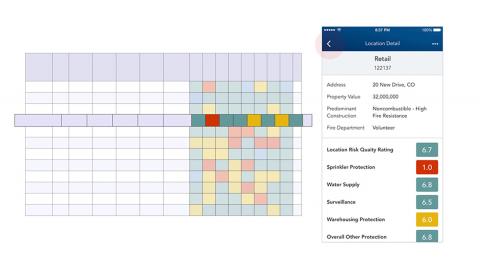
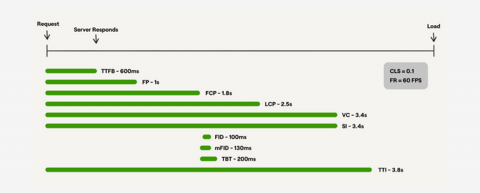
Ire Aderinokun at bitsofcode put together a nice overview of website performance metrics, such as First Contentful Paint (FCP), along with the ideal times for each metric.
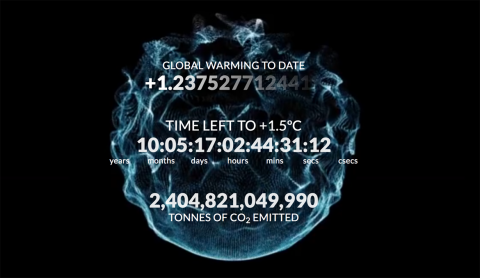
The Climate Clock shows that on the current emissions trend, we have 10 years before the planet hits +1.5 degrees warming. Net Zero by 2050 is too late.
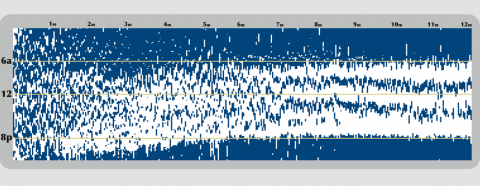
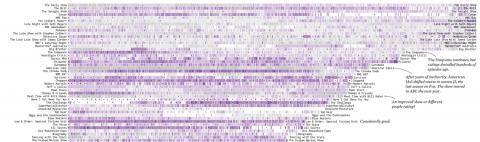
Nathan Yau over at Flowing Data plotted the IMDB ratings of the longest running TV shows, number one being The Daily Show with 4000 episodes and The Bill with 2402.
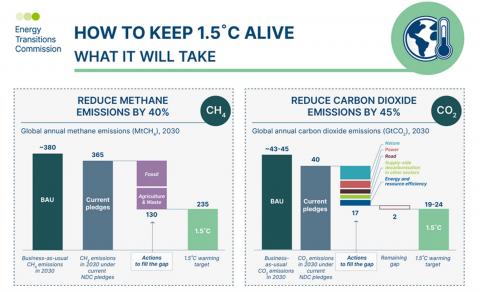
The Energy Transitions Commission published a new report detailing what is involved in order to meet the target of limiting global temperature rise to 1.5°C degrees.