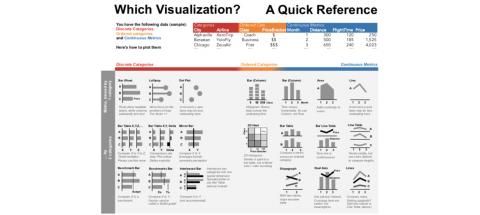
Steven Franconeri has created a nice data visualisation reference guide that helps you choose how to display data based on the structure of the data rather than on how people want to see the data.
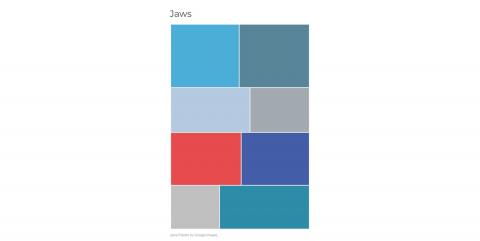
Swearch is an interesting tumblr project created by Dublin based art director Niall Staines. The site creates a palette of colours for a movie based on the pre-loader colour returned from a google images search for that movie.
On a more serious note, The New York Times has a chilling interactive data-vis showing how the recent Boeing 737-Max crashes were caused by faulty software and an over-reliance on a single angle of attack sensor.
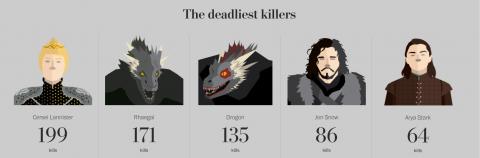
In anticipation of the final season of Game of Thrones, The Washington Post has updated its fabulous data-vis of all the deaths in Game of Thrones, included the most proficient killers! Winter is nearly here.
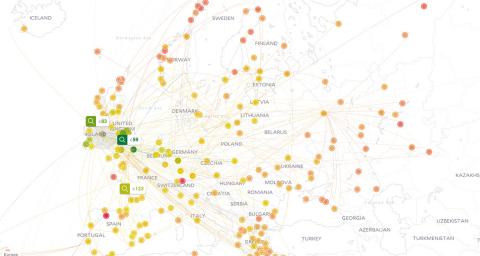
Find the cheapest flights from a starting point on any given day with greatescape.co. The flight search engine plots the options on a world map very nicely.
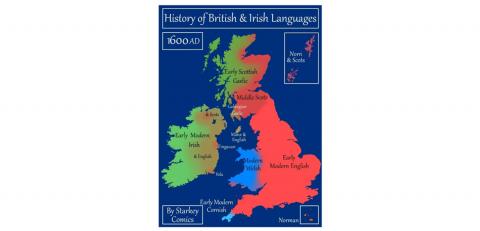
Ryan Starkey at StarkeyComics.com released a fantastic animated gif and blog post about the spread and decline of the different languages across Ireland and the UK from 400AD onwards.
Data Scientist Eric Berlow has analysed 100 years of Science Fiction output and analysed and categories the data. Theme trends show that exploration has seen a boom in recent years, but aliens are also on a comeback. The data also shows that the topic of AI has been re-introduced in the last 30 years.
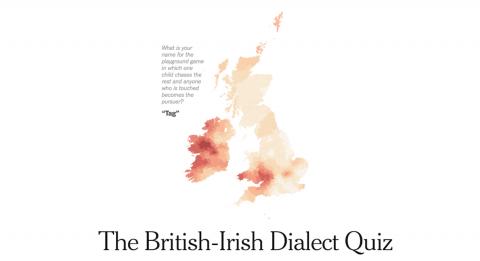
The New York Times also published a fun British-Irish Dialect quiz this week. Based on the answers given to questions about phrases, words and their meanings, the quiz plots a heat map of where it thinks you are from.
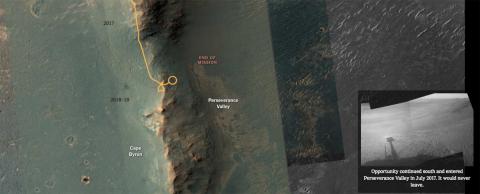
The New York Times have published a nice data visualisation of the 14 year journey taken by NASA's opportunity rover over 28 miles of the surface of Mars.
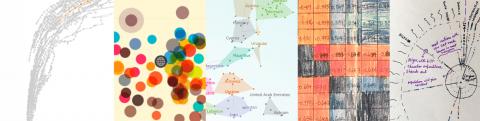
Information Is Beautiful have released the winners of the World Data Visualisation Prize 2019. The winners are categorised into interactive, napkin and static categories, along with a grand prize winner. The results are available on the Information Is Beautiful website.